Living in an apartment has some pros, especially in the Bay Area, where rent is not cheap, but it definitely has cons. I’ve been lucky to find a business-managed apartment complex that is clean, in a very good location, has all the amenities, and has large apartments where I can fit all my post-North Carolina stuff—almost.
Unfortunately, there was only a single-zone AC for such a big apartment with multiple bedrooms and large open spaces (living room, dining room, kitchen). In the summer, I have extremely hot rooms (sunny side of the building) and some quite cold. In winter, the apartment is generally cold, and the single thermostat next to the entrance does not help correctly assess conditions across the apartment. We’re either freezing or sweating – depending on where we spend time.
I’ve worked too long in IT not to try to solve this issue old-fashioned—with physics, electronics, and integrations. I’ve designed a local network with an internal server with DNS, Prometheus, Grafana, etc., and an isolated network behind the border gateway. So, I started to figure out the sensor setup I would like to use.
For quick and fairly accurate temperature measurement, I decided to use DHT11. It’s a common, easy-to-integrate sensor that can detect temperature changes around 0.1′ C. It also has a humidity sensor, so I can measure both with a single component. I grabbed a breadboard, Wemos D1 Mini clone (WiFi Arduino board), and jumper wires and started thinking. I’ve got a PoC sensor ready in a matter of minutes.
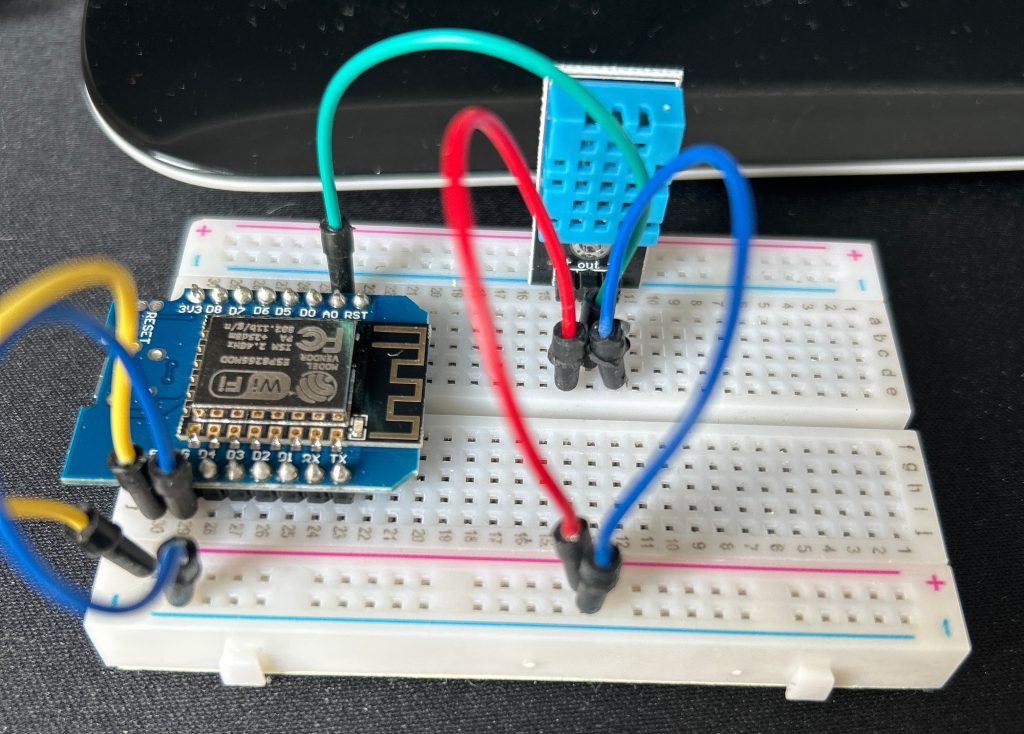
Next was the software part to burn into Arduino EEPROM. I tested the sensor, then modified the software to use the DNS host to push REST-formatted metrics to the collector server, and then jumped to write that one in Golang. Coupel of munites later I had collector hub, that was caching database, to which my PoC Wi-Fi temperature sensor was able to connect and push (POST) the sensor data. I added Prometheus metrics format output for this caching collector service and modified Prometheus to use it as a collector.
This way I can deploy my collector hub on server, open local TCP port in firewall and wait for devices to submit metrics. That part was tested and considered done.
The next day, because the PoC was successful, I decided to use a PCB and mount components more permanently. I needed a DHT sensor, a Wemos-clone Arduino device, a USB male connector, and a couple of wires.
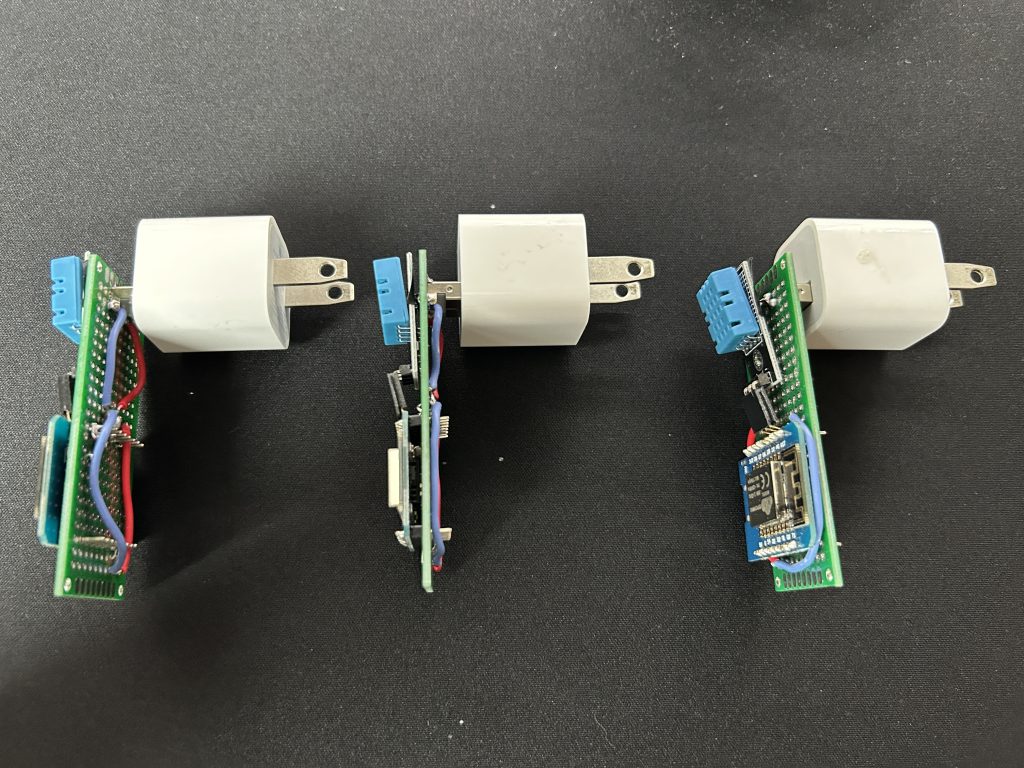
I made 3 of them – two for bedrooms and one for kitchen/living room. I updated the sensors’ firmware and uploaded the compiled sketch to all sensors. They were doing work in the following order:
- Connect to Wi-Fi
- Read sensor data
- Publish sensor data as a REST push call
- Go deep sleep for 1 minute, and collect another data sample.
The device would be power efficient with the use of deep sleep functionality.
Software
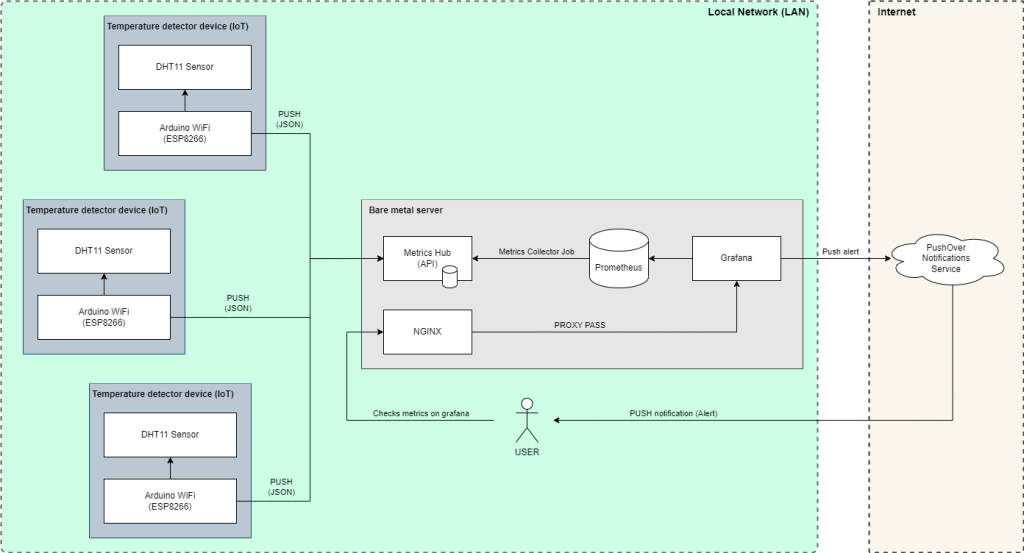
In the first phase, I was using the PushOver notification, but I migrated to a local Mattermost server (consider this a locally running Slack that looks and works the same as Slack but is hosted locally). I do have a wholly isolated home network with my own local DNS server, NGINX proxy, and EdgeRouter (DHCP and physical isolation).
Before migration, that was my draft of networking architecture:
Firmware
In Arduino IDE I did created new project, included all the drivers (DHT, ESP8266 WiFi), preconfigured some constants like WiFi name & password, host, port and path to push JSON-formatted metrics etc.
I created a configuration (setup function) that connects to WiFi. grabs data from the sensor, and formats it into a JSON string.
For simplicity and power efficiency I used string formatting:
#include <ESP8266WiFi.h>
#include <DHT.h>

#define DHTPIN D5               // Pin D5 where the data line is connected
#define DHTTYPE DHT11           // DHT 11 sensor type
#define JSON_FMT_STR "{\"temp\": %.2f, \"hum\": %.2f}"
#define WIFI_SSID "<the WiFi Netowrk SSID>"  // Wi-Fi SSID
#define WIFI_PASSWORD "<the WIFI Network Password>" // Wi-Fi password
#define ENC_HOSTNAME  "<device host name>"
#define SLEEP_TIME 60e6         // 60 sec timeout

// Initialize DHT sensor
DHT dht(DHTPIN, DHTTYPE);

void setup() {
  // Start DHT sensor
  dht.begin();

  // Connect to Wi-Fi
  WiFi.mode(WIFI_STA);
  WiFi.begin(WIFI_SSID, WIFI_PASSWORD);

  // Wait for Wi-Fi to connect
  while (WiFi.status() != WL_CONNECTED) {
    delay(100);
  }
}

void loop() {
  // Read DHT sensor data
  float humidity = dht.readHumidity();
  float temperature = dht.readTemperature();

  // Skip if sensor data is invalid
  if (isnan(humidity) || isnan(temperature)) {
    ESP.deepSleep(SLEEP_TIME); // Deep sleep for 3 minutes
    return;
  }

  // Format JSON string
  char jsonBuffer[64];
  sprintf(jsonBuffer, JSON_FMT_STR, temperature, humidity);

  // Send data via HTTP POST
  if (WiFi.status() == WL_CONNECTED) {
    WiFiClient client;
    if (client.connect("<my server hostname>", 12345 /* server port */)) {
      // Construct and send HTTP POST request (HTTP headers + body)
      client.print("POST /submits/");
      client.print(ENC_HOSTNAME); // Use DHCP-assigned hostname
      client.println(" HTTP/1.1");
      client.println("Host: <my server hostname>");
      client.println("Content-Type: application/json");
      client.print("Content-Length: ");
      client.println(strlen(jsonBuffer));
      client.println();
      client.print(jsonBuffer);
      client.println();
    }
    client.stop();
  }

  ESP.deepSleep(SLEEP_TIME);        // Deep sleep (180 seconds)
}
I made a couple of resource-focused decisions in the code. Instead of using a specific HTTP library, I decided to construct HTTP headers and bodies manually by printing to the client directly. This is a RAW TCP client, so all HTTP headers need to be present when pushing a message.
Reading happens in a loop, but technically it doesn’t matter – it can be in a setup() function as ESP.deepSleep() function resets device after specific amount of time, so setup() function is executed. Still just to be sure I’m checking if WiFi is connected before trying to submit the data.
Metrics cache
I wrote a metrics cache (metrics hub) in Golang. The core functionality of a metrics hub is to be a point where devices can push their metrics as JSON, and then the server can collect them and present them in various formats to be consumed (like Prometheus metrics).
package main

import (
	"bytes"
	"fmt"
	"github.com/gin-gonic/gin"
	"log"
	"net/http"
	"sync"
	"time"
)

const (
	FMT_PROMETHEUS = "prom"
	FMT_JSON       = "json"

	/*
		# HELP http_requests_total The total number of HTTP requests.
		# TYPE http_requests_total counter
		http_requests_total{method="post",code="200"} 1027 1395066363000
		http_requests_total{method="post",code="400"}    3 1395066363000
	*/
	PROM_TMP_HDR_FMT = "# HELP dev_rep_temp_cel The reported temperature\n# TYPE dev_rep_temp_cel gauge\n"
	PROM_TMP_ENT_FMT = "dev_rep_temp_cel{device=\"%s\",} %.2f\n"
	PROM_HUM_HDR_FMT = "# HELP dev_rep_hum_percent The reported humidity\n# TYPE dev_rep_hum_percent gauge\n"
	PROM_HUM_ENT_FMT = "dev_rep_hum_percent{device=\"%s\",} %.2f\n"
)

type TempEntry struct {
	Humidity    float32 `json:"hum"`
	Temperature float32 `json:"temp"`
}

var (
	temps     map[string]TempEntry
	ptUpdates map[string]time.Time
	tempsMtx  sync.Mutex
	router    *gin.Engine
)

func main() {
	temps = make(map[string]TempEntry)
	ptUpdates = make(map[string]time.Time)

	go func() {
		t := time.NewTicker(time.Hour)
		for _ = range t.C {
			tn := time.Now()
			cleanup()
			log.Printf("Autocleanup done in %.2f seconds", time.Since(tn).Seconds())
		}
	}()

	router = gin.New()

	router.POST("/submits/:host", dataRegister)
	router.GET("/data/stats", getAllUpdates)
	router.GET("/data/results", getAll)
	router.GET("/", endpoints)

	router.Run("0.0.0.0:8115")
}

// endpoints lists all endpoints
func endpoints(context *gin.Context) {
	var endpointsList string
	routes := router.Routes()
	for _, route := range routes {
		endpointsList += fmt.Sprintf("  %s %s\n", route.Method, route.Path)
	}
	context.String(http.StatusOK, "Endpoints:\n%s", endpointsList)
}

// cleanup is background function that removes all entries that are older than 240 minutes (4 hours)
func cleanup() {
	tempsMtx.Lock()
	defer tempsMtx.Unlock()

	for k, v := range ptUpdates {
		updTime := time.Since(v).Minutes()
		if updTime > 240 {
			delete(ptUpdates, k)
			delete(temps, k)
		}
	}
}

// getAllUpdates returns all update times values in JSON format
func getAllUpdates(context *gin.Context) {
	updatesTimes := make(map[string]string)
	tempsMtx.Lock()
	defer tempsMtx.Unlock()

	for k, v := range ptUpdates {
		prefix := "OK"
		updTime := time.Since(v).Minutes()
		switch {
		case updTime >= 10 && updTime < 30:
			prefix = "OLD"
			break
		case updTime >= 30 && updTime < 120:
			prefix = "VANISHED"
			break
		case updTime > 120:
			prefix = "REMOVED"
			delete(ptUpdates, k)
			delete(temps, k)
			break
		}

		updatesTimes[k] = fmt.Sprintf("[%s] Updated %2.f minutes ago", prefix, updTime)
	}
	context.JSON(http.StatusOK, updatesTimes)
}

// getAll returns all data in entries memory in specific format
// For prometheus: ?fmt=prom
// For JSON: ?fmt=json
func getAll(context *gin.Context) {
	switch context.Query("fmt") {
	case FMT_PROMETHEUS, "":
		promFormatter(context)
	case FMT_JSON:
		jsonFormatter(context)
	}
}

// jsonFormatter returns data in JSON format (direct serialization) and application/json mime
func jsonFormatter(context *gin.Context) {
	tempsMtx.Lock()
	context.JSON(http.StatusOK, temps)
	tempsMtx.Unlock()
}

// promFormatter returns data in Prometheus format (by buffers filling and merging) and text/plain mime
func promFormatter(context *gin.Context) {
	buffT := bytes.NewBufferString(PROM_TMP_HDR_FMT)
	buffH := bytes.NewBufferString(PROM_HUM_HDR_FMT)

	tempsMtx.Lock()
	for k, v := range temps {
		buffT.WriteString(fmt.Sprintf(PROM_TMP_ENT_FMT, k, v.Temperature))
		buffH.WriteString(fmt.Sprintf(PROM_HUM_ENT_FMT, k, v.Humidity))
	}
	tempsMtx.Unlock()

	context.String(http.StatusOK, "%s\n\n%s\n", buffT.String(), buffH.String())
}

// dataRegister records provided data based on given host (bucket) where URI is /submits/<host>
func dataRegister(context *gin.Context) {
	host := context.Param("host")
	if host == "" {
		fmt.Println("host is empty!")
		context.AbortWithStatus(http.StatusBadRequest)
		return
	}
	var te TempEntry

	if err := context.ShouldBindBodyWithJSON(&te); err != nil {
		fmt.Println(err)
		context.AbortWithStatus(http.StatusBadRequest)
		return
	}

	tempsMtx.Lock()
	temps[host] = te
	ptUpdates[host] = time.Now()
	tempsMtx.Unlock()
	context.String(http.StatusOK, "OK")
	return
}
For this purpose, I used the Gin framework and some maps protected with Mutex (yes, I know I should use RWMutex). Instead of using the Prometheus go library, I decided again to format strings manually in the buffer and return the body. This will be consumed by Prometheus mainly, so I would assume I don’t need to optimize the code too much.
Finally Service will be running in Gentoo so I did prepared OpenRC script for that purpose:
#!/sbin/openrc-run

description="Service for exttempmon Golang application"
command="/usr/bin/exttempmon"
command_args=">> /var/log/exttempmon.log 2>&1"
pidfile="/var/run/exttempmon.pid"
name="exttempmon"

depend() {
    need net
}

start_pre() {
    checkpath -d -m 0755 /var/log
    checkpath -f -m 0644 /var/log/exttempmon.log
}

start() {
    ebegin "Starting ${name}"
    start-stop-daemon --start --background \
        --make-pidfile --pidfile "${pidfile}" \
        --exec ${command} -- ${command_args}
    eend $?
}

stop() {
    ebegin "Stopping ${name}"
    start-stop-daemon --stop --pidfile "${pidfile}"
    eend $?
}
I just needed to run the service and check it’s up:

Testing the metrics
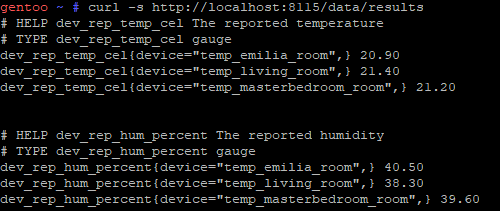
To test the metrics I did used CURL. Those metrics are exposed in local network only at /data/stats endpoint, so I can query them directly on the server.
Firstly I did checked if all devices are sending metrics to the hub:

Then I did checked the reported values:
And JSON formatting:
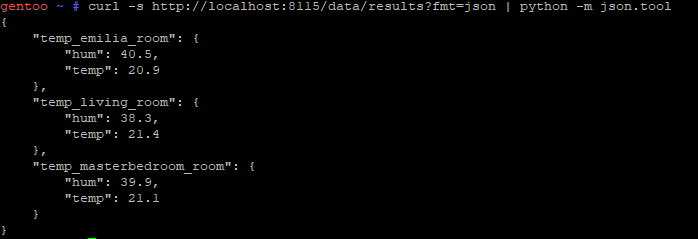
Everything looks fine. Now we’re going deeper into rabbit hole – configuring Prometheus to pull those metrics.
Prometheus
To configure prometheus I did added my endpoint to prometheus.yml:
...
# temp sensors hub
  - job_name: "temp_sensors_hub"
    scrape_interval: 60s
    metrics_path: /data/results
    static_configs:
      - targets: ["<my server internal IP>:8115"]
...
I did restarted Prometheus service and validated that metrics scraping works correctly:

It was a time for Grafana.
Grafana
In grafana, I created a new dashboard, and introduced separate charts for humidity and temperature:
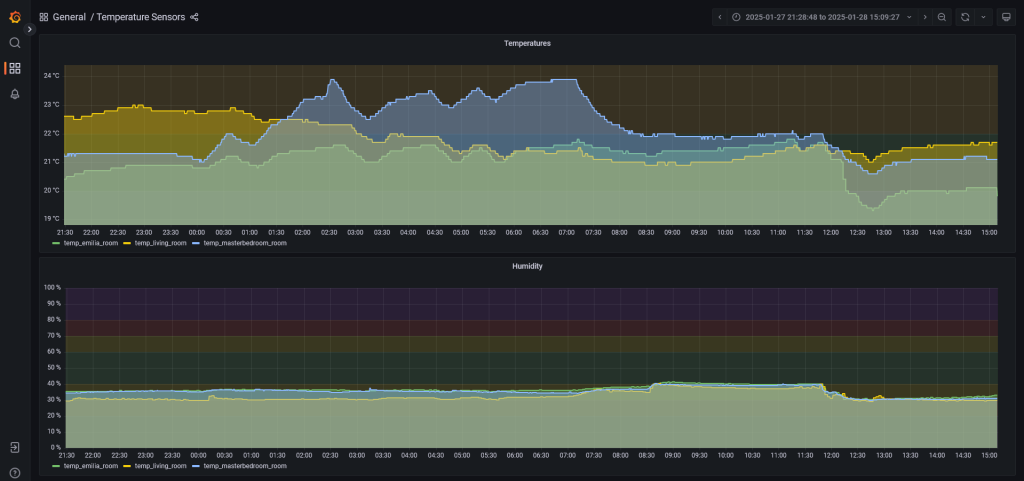
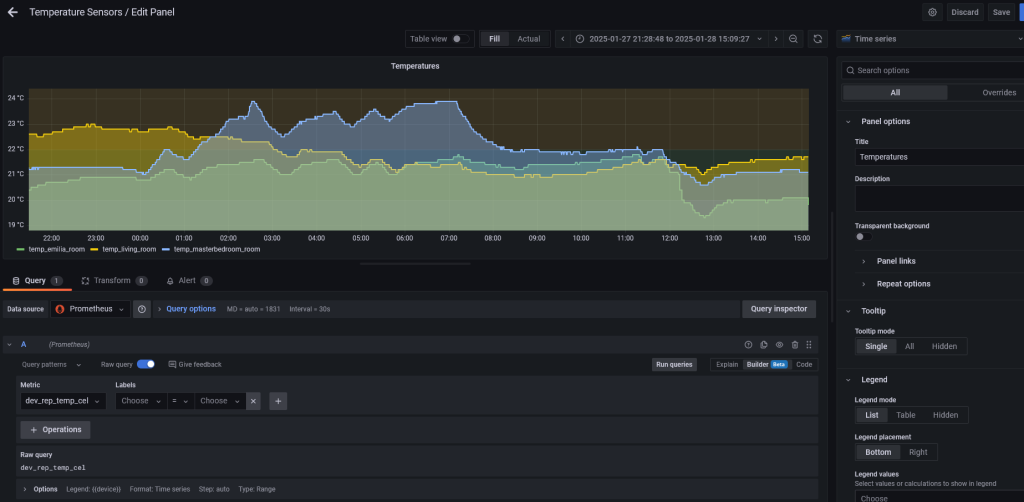
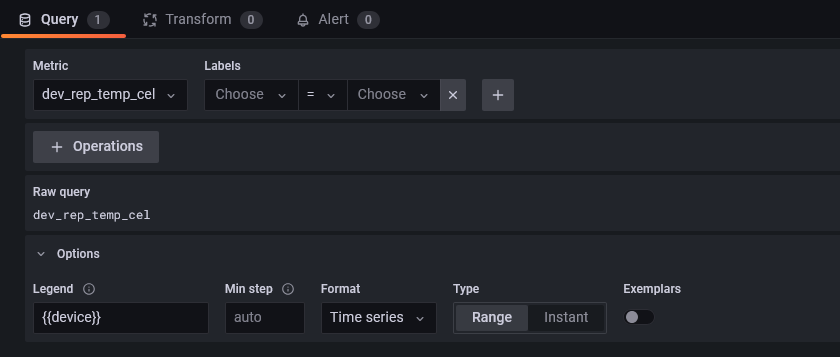
Because the metrics were already properly tagged/labeled, I was able to use simple queries to build charts:
As a next step, I configured the alerting:

With default sink to my local Mattermost server:
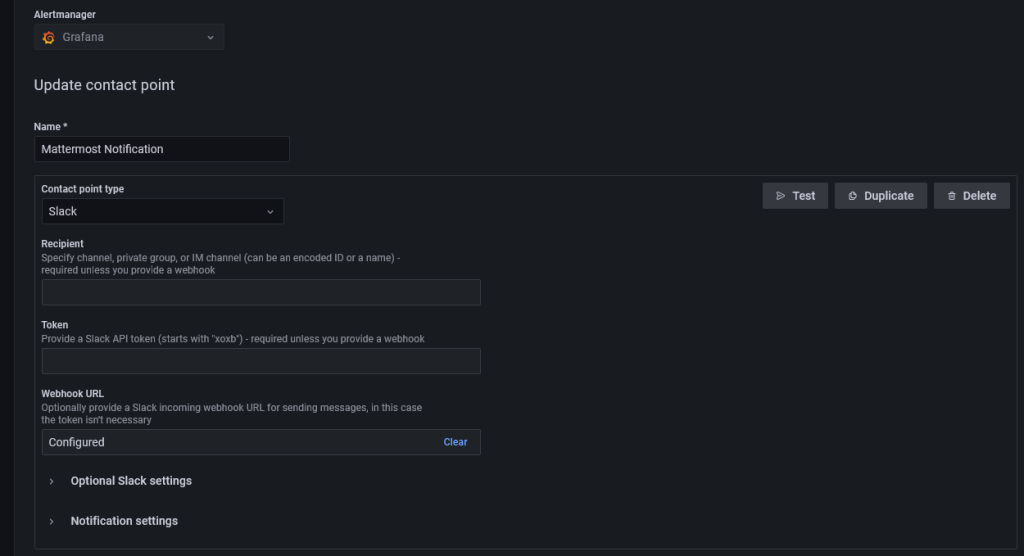
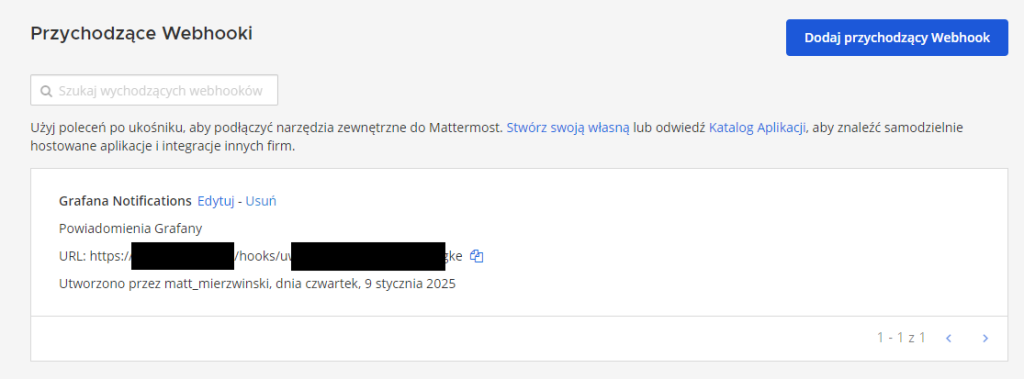
And on the Mattermost side:
What affected following alerts to be thrown:

The pro of Mattermost is that it’s fully slack-compatible on Webhooks side of it’s API so in Grafana configuration is simple as setting up slack format and providing Webhook URL to local Mattermost server instead of Slack.
Summary
This short two-day project tested my integration skills from top to bottom. Day 1 was focused on making the device PoC and writing the first version of firmware and a simple metrics hub. On day 2, I was able to solder everything, tweak the firmware, finish the metrics hub, and integrate this with Prometheus and Grafana.
The pros of my isolated network are that even if the Internet connection is down, I will be able to open Grafana (I have local DNS, DHCP, and edge router), sensors will be able to submit their data to the server, and everything will be working without interruptions—including Mattermost service.
This way, I was able to build an efficient, off-cloud solution that is not affected by network downtime.
